1. Introduction
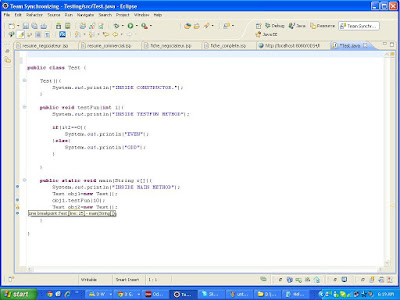
To set breakpoints right click in the small left column in your source code editor and select "Toggle Breakpoint". Or you can double click on this position.
If you have not defined any breakpoints, this will run your program as normal. To debug the program you need to define breakpoints.
If you start the debugger the first time, Eclipse ask you if you want to switch to the debug perspective. Answer "yes". You should then see a perspective similar to the following.
You can use F5 / F6, F7 and F8 to step through your coding. The meaning of these keys are explained in the following table.
Debugging allows you to run the program interactively and to watch the source code and the variables during this execution.
A Java program can be started in "Debug mode". You can set breakpoints in your Java code in which the execution of the Java code will stop if the Java program is executed in "Debug mode".
2 .Set Breakpoints
3. Star Debugger
You can debug your application, select a Java file which contains a main method, right click it and select →.
If you start the debugger the first time, Eclipse ask you if you want to switch to the debug perspective. Answer "yes". You should then see a perspective similar to the following.
You can use F5 / F6, F7 and F8 to step through your coding. The meaning of these keys are explained in the following table.
| Command | Description |
|---|---|
| F5 | Goes to the next step in your program. If the next step is a method / function this command will jump into the associated code. |
| F6 | F6 will step over the call, e.g. it will call a method / function without entering the associated code. |
| F7 | F7 will go to the caller of the method/ function. So this will leave the current code and go to the calling code. |
| F8 | Use F8 to go to the next breakpoint. If no further breakpoint is encountered then the program will normally run. |
Thank You.


No comments:
Post a Comment